Using maps and data to assess and improve tree canopy cover in North Texas
Maps are a powerful tool used in urban forestry that help people understand the different types of trees a city has, where they are located, and about their health and growth. Most mapping of the urban forest is done electronically through “Geographical Information Systems”, or GIS.
What Are GIS Maps?
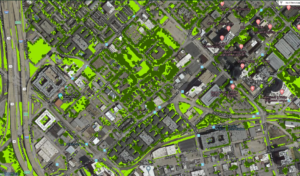
GIS maps analyze data across a city, county or region while helping foresters learn more about the trees in the area. These maps can be used to calculate the Urban Tree Canopy (UTC) percentage - the amount of land covered by trees.
Knowing what percent UTC a city has and the areas of that have a high or low UTC is important for several reasons. Trees help reduce the urban heat island effect by shading impervious surfaces such as parking lots and streets, clean the air, reduce peak stormwater flow and enhance open spaces for people to gather.
In Dallas, Texas, the current UTC is 30% which (when compared to other cities of similar size) may seem high. However, UTC maps have shown that the canopy of Dallas is not evenly distributed, leaving some areas with a high percentage of canopy, and others with very little. GIS helps urban foresters understand what areas of the city lack important tree canopy cover and develop strategic tree planting goals.
Why Is Mapping Trees Important?
Tree mapping is done by cities and organizations, such as the Texas Trees Foundation, to help city leaders understand the urban forest and develop maintenance strategies. These tree inventories can cover small neighborhoods, whole cities or entire states.
All maps are a snapshot in time that show what is happening right when they are captured. This time stamp leads to some limitations when maps are created, especially as they get older. However, with repeated mapping and updating, these snapshots can tell powerful stories about how urban forests change over time.
Tracking the urban forest over time allows for better decision making when planning where new trees need to be planted, where existing trees can be preserved and enables a municipality to track the success of their programs over time.
How Do We Map Tree Canopies?
GIS data can be collected in various ways, but one common mode of data collection is through remote sensing using aerial imagery from airplanes and satellites. Remote sensing gives experts rough data about their city’s land cover (buildings, roads, agriculture, trees, etc.) and UTC percentages.
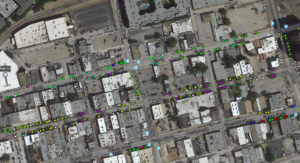
More detailed data require urban foresters to conduct on the ground inventories of trees and enter this data into their GIS maps. Information about tree species, diameter, height and tree health are generally collected on the ground.
You cannot manage what you don’t know you have. Combining these two types of data collection give urban foresters a powerful tool to analyze the composition, heathy and age of the urban forest they are managing.
Citizen Science Tree Mapping
Citizen Science, research conducted by community members, is key for many successful urban forests around the United States. Citizens can help conduct tree inventory and enter data into the GIS mapping program to help urban foresters better understand and manage the urban forest.
The Texas Trees Foundation hosts an online GIS mapping program for trees across North Texas called TreePlotter. This virtual tree map enables foresters, cities and residents to add their own tree data.